Even if you blog for the pure love of creating and posting, attracting traffic and seeing traffic increase is icing on the cake, or if you’re like me and you prefer savory to sweet, traffic is like gravy on the french fries. (Mmmm….gravy.) Today, we’ve got a quick tip to help you see exactly how much gravy, er, traffic individual posts get over time. Meet the small but mighty magnifying glass.
The magnifying glass appears to the right of post titles in the Top Posts and Pages box on your site’s stats page. To view your stats, go to Dashboard > Site Stats. (You can also get to your stats page by clicking on the sparkline chart in your admin bar.)
On the Site Stats, page, look for the box called Top Posts and Pages. Here’s a screenshot of The Daily Post‘s Top Posts and Pages:

Click on the magnifying glass next to the title of any post. You’ll see a stats page that shows the number of views the post has received since you published it. The stats charts that follow are for a perennially popular post here at The Daily Post, called “Choosing the Perfect Blog Name: Two WordPressers Share Their Secrets.” Here are the views that post has received since we published it in November, 2012:

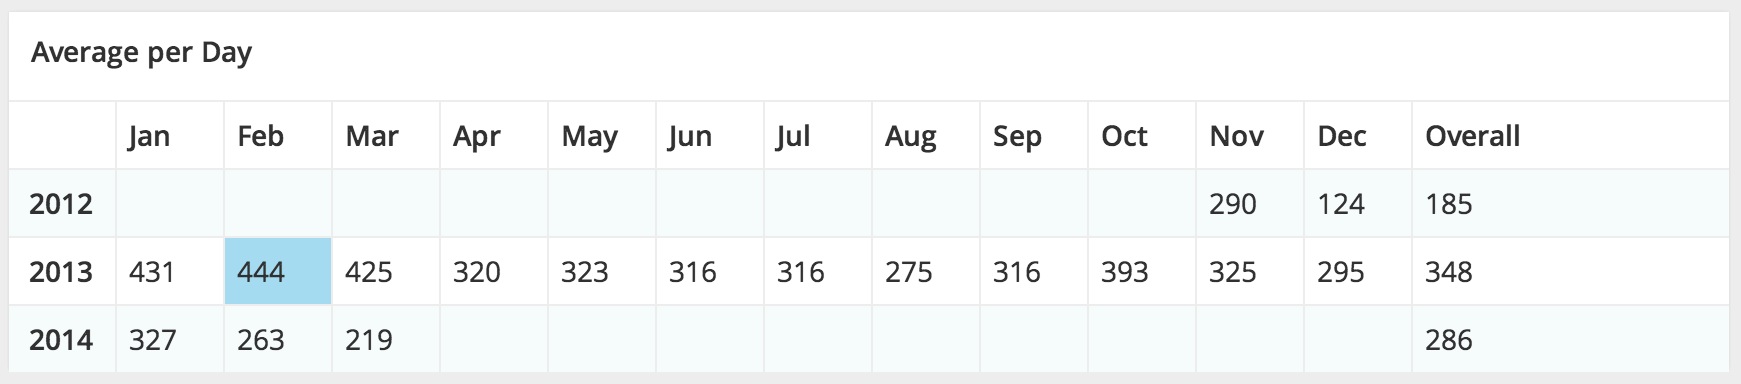
Here’s the chart that shows the average number of visits the post has received over time. This is super handy to find out whether visits are increasing or dropping off:
There’s also a chart that details traffic in the most recent weeks which also lets you know whether traffic is going up or down:

If you’re not ignoring stats altogether, the minuscule but mighty magnifying glass can help you determine which of your posts resonate with your audience over time. While you’ve got your nose in your stats, check for stats patterns and spikes: do you find traffic tends to peak Monday through Wednesday and then slows as the weekend approaches? Planning your editorial calendar to publish posts on popular topics when you know your audience will come to call can give your traffic a boost and your readers more of what they clearly love. Win-win.
Currently blogless? You’re a click away from sharing your story.
Create your blog at WordPress.com


As I am very new to bogging and your site, this is a huge help to me. I have only posted 5 blogs so far, but as time goes on and I post more I know now that I will be able to see what my most popular topics are so I can write about them more. Thank you.
LikeLiked by 1 person
Is there a way to drill down further in a more granular way to find out what regions, browsers, etc. are used for each view?
LikeLike
Hi @Jose, you can see views by country over time by clicking on the “Summaries” link on the Views by Country stats box. The Views by Country box shows views by country for the day, and for the previous day, by clicking on the “Yesterday” link.
The Summaries view doesn’t show you views by day, but you can see views by country for the past 7 days, 30 days, the last quarter, the last year, and for all time.
LikeLike
Is there a state view for the us in the dashboard? I want to use my traffic to analyze different state universities needs
LikeLiked by 1 person
Krista, love the posts: thanks for the feedback.
LikeLiked by 1 person
There isn’t a view by US state, I’m afraid.
LikeLike
Thanks for sharing. I already used the option. I’ve noticed my posts traffic drops after about 3 weeks. I think this is due to actual coverage of shared links to the posts. I usually put up links in LinkedIn and Twitter so they fade away after a while. However, lately Google is helping out more and more, only half of the traffic comes from direct links on LinkedIn now a day’s. It’s great to just sit down and look at the stats for a while, you never know what you’ll find 🙂
LikeLiked by 1 person
Thank you. Useful. That is often the information I want, to know how a particular post has done … and not just the overall “final” numbers but the numbers along the way.
Mutiara singaraja
LikeLiked by 1 person
So helpful! Thank you!
LikeLiked by 1 person