Or more than just an excuse to down a pint of Ben and Jerry’s and vow to give up blogging forever, as the case may be.
Most of us look at our stats more than we probably should; it’s natural to want to see whether anyone’s paying attention, and undeniably gratifying to watch the graphs go up, up, and away. But if you’re trying to build a readership and are not using the world of data lurking in your stats to inform your blog and boost your traffic, you’re missing out. Your stats page is way more than a bunch of charts with the power to boost or kill your confidence — it’s a bunch of charts that give you the ability to see into the minds of your readers and shape your blog accordingly.
Before we go any further, a caveat. This post is simply intended to help you pull information from your stats that might help you boost traffic and engage readers, but we know that for some of you, that’s not the point of blogging. There are plenty of people who use their sites as personal spaces to muse, vent, play with words, make one-on-one connections, or do a thousand other things that aren’t about building traffic. If that describes you, then keep on keeping on and ignore this post! If you’re looking to build more of an audience for your site, read on.
There’s a huge quantity of data captured on your stats page. For today, we’re going to focus on overall views and visitors, top posts and pages, and tags, and search engine terms.
Views and Visitors
This is the big ol’ graph with the light and dark blue bars right at the top of the page. Here’s ours:
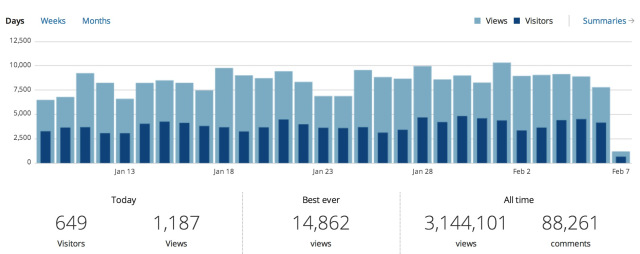
This chart tracks both views and unique visitors; the light blue bars represent views, and the darker blue represents unique visitors. A view is counted every time anyone loads a page on your blog (for example, your “About” page or an individual post’s page), while a unique visitor is counted whenever a user visits your blog for the first time that day, week, or month. If your mom visited your blog twice today and clicked on three pages, she’d show up as three views and one unique visitor for the day.
At the top of the chart, you can choose what time period it covers — days, weeks, or months. Day view is great for seeing the impact of specific posts, but week and month view give you the data that helps you grow.
Looking at your stats in week or month view, you can see what happened when you started posting more frequently, introduced that new feature, or changed your theme. You can see whether there are times of the month or year that are bigger for you; maybe you write a food blog and see holiday season spikes as the internet descends on your killer cranberry sauce recipe, or your pop culture blog gets a boost from tired workers killing the last few hours of a Friday afternoon.
Use this information to inform (or create) your posting schedule. You can either map out a calendar in advance (“I’ll prep eight Passover recipe posts and roll them out as the holiday approaches.”) or just time your posts to coincide with your visitors — there’s no need to rush to hit publish on a post you wrote on Saturday if your traffic spikes on Tuesdays. These stats might also give you insights into your content, especially if you write about multiple topics. Perhaps there’s one topic that resonates with more people, or different topics are more popular at different times. Which brings us to…
Top Posts, Pages, and Tags
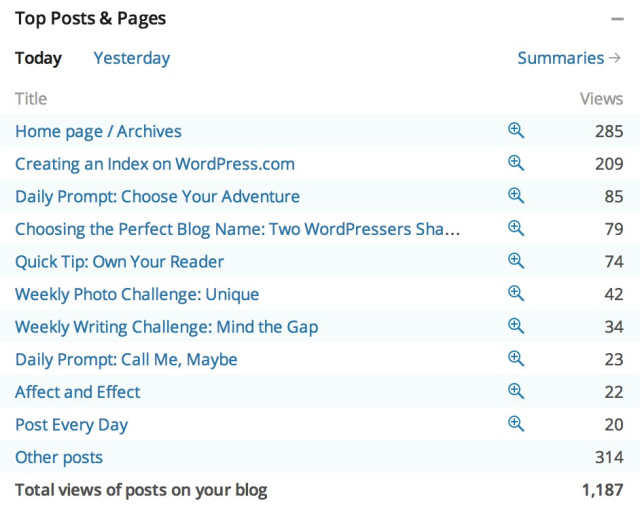
“Top Posts & Pages” collects data on, um, your top posts and pages:
While “Top Tags” does the same for — you guessed it — tags:
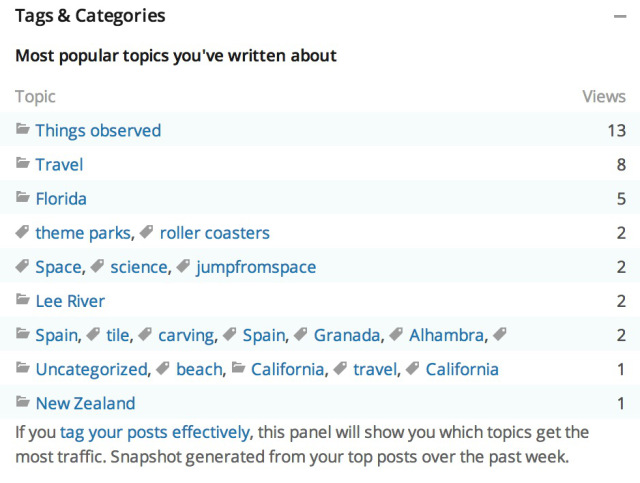
You can quickly see what readers were most drawn to yesterday and today, and click on “Summaries” to access historical data and see what’s been popular in the past week, past month, or over the lifetime of your blog. Make sure you’re tagging your posts effectively to get the most out of these stats.
See if there are particular topics where your blog shines, or if you can spot trends among popular posts. Then, you can give you readers more of what they enjoy: try a follow-up to your most popular post, or introduce a new series based on reader interest. If a series or topic is falling flat, you can consider retiring it and experimenting with something new based on what people are responding to.
You might also use menus and widgets to direct people to your best stuff. Link to your greatest hits right from your “About” page, or add a widget listing your most popular posts — drive new visitors to posts that will suck them in, and they’ll be more likely to stick around.
It’s also smart to see what pages are racking up the views so you can keep them up-to-date. Since pages are static, we can easily forget about them and let their content grow stale. Your “About” page is a prime candidate — when was the last time you looked at that thing? (If yours hasn’t been refreshed since you started your blog, check out About 101 and 201 for help breathing in some new life.)
Search Engine Terms
The search terms data is the piece of your stats page most likely to make you snort ginger ale out your nose in laughter, horror, or both. These are the terms people Googled (or Yahoo-ed, or Bing-ed, or whatever-ed) to find your site. Here’s a sample of ours:
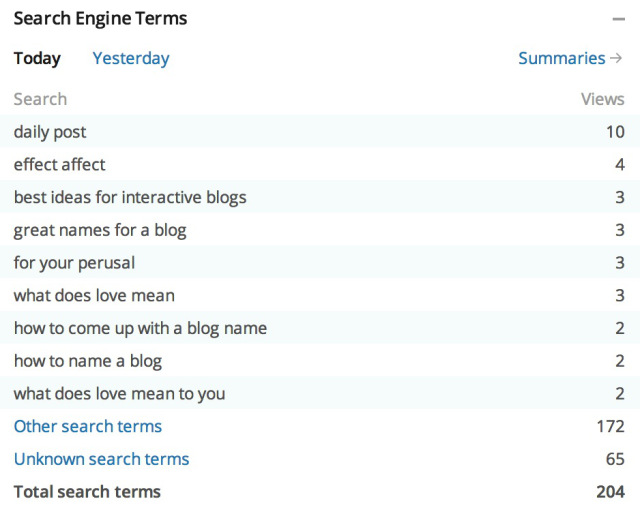
As you can see, we’re popular with both bloggers and hopeless romantics.
Thanks to the wonders of search algorithms, these stats will be full of hilarious, confusing, and infuriating terms that you’ve probably never written about, ever. At the very least, you’ll get fodder for the ever-popular “Look at these ridiculous search terms!” post; at best, you’ll find more useful data on what subjects people are interested in and what kinds of key words and phrases will make your posts and titles sing.
There’s lots of other helpful information on your stats pages, like readers’ countries and sites that refer readers to you; we’ll touch on that in a future post.
Have you used your statistics to inform your blog, or are they just a fun distraction? We’d love to hear from those of you who have used your stat data to engage and grow your readership!
Currently blogless? You’re a click away from sharing your story.
Create your blog at WordPress.com


What a great idea- to look at my search term summaries!
The weirdest one is “yon. love dies” and the top one is “sunset photography” which is awesome cause that means I’m on the right track.
Yesterday was one of those days where everything went badly except when I read my stats one of them made me laugh, so thank you WordPress for this feature.
LikeLike
thank you for this real and interesting topic… For me, since a long time, I’ve noticed the importance of statistics as a way of knowing what really my loyal readers expect from me to write. I founded that in two or three specific occasions, my stats goes up and up, and because of your advices, I wrote again about the same topics that attract my readers, and it worked 🙂
Thank you again and again
LikeLike
Great info for a newbie trying to build readership.
LikeLike
The trend is what counts – my visits per week are all over the map – no trend other than when I Post something new – visits go up – the other trend over two years is up in the summer and down in the winter. But since my site deals with Boating Safety & other Tips so the seasonal part makes sense –
But it is a bit unsettling to watch the visits go down in the fall and into the December basement.
Yes I waste time by watching the stats too much and even have a spread sheet showing the highest views per month and the ranking from the last 31 months (all the stats I have) – but I don’t freak out from hour to hour or even day to day – some people should never ever take a look at the stats
LikeLike
The seasonal drop happens for a lot of bloggers, including The Daily Post (maybe we’ll write about it — thanks!).
As for watching stats hourly, I became a much happier blogger when I decided to limit how often I checked my stats, and I suspect the same would be true for many others!
LikeLike
I have taken found that some of the searches in the search engine section are questions that relate to my experiences. I have copied and saved them. Periodically I address these search questions in a post. Great information for me to use in continuing to use the statistic page.
LikeLike
interesting post- thanks!
LikeLike
good to know the hows & whys. Really useful, thank u!
LikeLike
Statistics are useful & affirmational.
As are likes & follows.
But the true measure of a successfully expressed idea is a meaningful contextually appropriate comment.
Most of the time, I am simply typing out loud.
LikeLike
Reblogged this on Kevs' Blog.
LikeLike
I like to see how my posts are doing. I am amazed that sometimes I post two or three times a day and get few viewers and not post for two days-and get a high amount of viewers. Sometimes the posts I like best are not the ones others like… and my history gets the most views.
LikeLike
I’m not a very sophisticated blogger, and I have never really bothered with stats. Perhaps I should take a look. Basically, I write what I want; either people like it or they don’t. I’m not concerned about gaining a “following.” A discussion among a few friends is great for me.
LikeLike
Then you fall into the “caveat” group — just keep doing what you’re doing!
LikeLike
I am sooo lazy. I start to do some of the things that would expand my audience but it really does take discipline. My attention deficit disorder kicks in and end up with 3497 open windows of stuff i want to come back to later, 4 lists of to-do’s.and a wikkie correction that has to be made on the spot. My biggest spike came when I wrote about my first penis. I guess I can infer from that that people would like to spice things up, reading wise. If you love writing, it is important not to let the stats drag you down. *
LikeLike
I look at my stats all the time. I love it that I can now see both the number of visitors and the number of posts seen. Before that I always wondered if my stats were just a lot of people coming to my posts accidentally and leaving right away, but now that I can see that there are a lot less visitors than posts read, I know that some people actually read a post and then want more. That’s a good feeling. Thanks!
LikeLike
Reblogged this on A Daily Rough Draft and commented:
Day 2 of blogging and this is exactly how I feel…always checking my stats…always fearing who the stats represent…which friends are reading, which friends are judging…lol
LikeLike
well for me I do take the data and look to see if i’m the only one reading it. then i look to see what was read. I love the two toned color bar of visits vs vistor.
I also look to find out how many i have posted. I like to see what was used the most.
http://www.kodiakmylittlegrizzly.com today i tried to make 100 post different
LikeLike
Actually I really felt addicted by your stats page. I’m sober for two weeks now, and I’m trying to at least don’t look on the page for a full month. I wrote a post about it: http://shiggyenterprises.wordpress.com/2013/04/18/statistics-addict-2/
I absorbed every little information and was trying to publish to improve the stats. But I realized that it eats way to much time and nerves. I was looking at the stats at least 10 times a day and was always worried if there was a drop in visitors. I although annoyed my wife with hijacking her devices to keep track of the stats during the ‘family time’.
The pull is still hard, but I will keep resisting it.
Any chance for a feature to lock yourself out of the stats view for a defined time. I can avoid looking at the full-blown stats page, but the little bar chart on top of the page keeps mocking me.
LikeLike
There’s an area on the forums where you can suggest features: https://wordpress.com/forums/forum/ideas
I’m sure you’re not the only one trying to limit your exposure to stats; it’s actually a great way to maintain your sanity. Worrying about hourly or even daily or weekly fluctuations is an awesome way… to get discouraged and burn out.
LikeLike
Thanks for pointing that out. I will drop my feature request there.
LikeLike
Insightful and funny post 🙂
LikeLike
Really interesting read, and describes my stats addiction perfectly!!
I see a huge boost in viewers on the day after I post, probably because of the time difference between Cambodia and home (Ireland), and posting on FB is my biggest way of drawing visitors!
LikeLike
Thank you a million times over for this post. Very powerful and informing. It made me look at the stats with a completely new eye. Up to now I have only been, what you can call, a stats junkie – looking at the total views for the day and that’s it. I’ve just delved a bit deeper (as per your post) and was amazed at the amount of information. Keep up the good work!
LikeLike
Thanks! Glad to hear it was so helpful 🙂
LikeLike
often the blog posts with most views, faves or comments are not the most important articles. If we look back after some months we realize other posts – and comments – remained in our heart, appearing in our daily thoughts. Blogging means to find out a balance between diving into own personal history and development of language – and on the other hand: to find topics which are attractive to all readers…
LikeLike
The main thing I got from this wonderful article was to take a look at my About page…I’m a new blogger and so stat count is low and not a massive priority right now…I have come up with a new About idea though…let me know what you think…WIP
http://paulscribbles.wordpress.com/about/
LikeLike
You might want to ask for feedback in the next Community Pool, on Sunday — it’s expressly for bloggers looking for input from other bloggers.
LikeLike
It is indeed really helpful feature for me as a newly blogger in wordpress. I should use more out of this information to be able to customize my blog 🙂
LikeLike
The search engine terms often are the most interesting things, especially when people type in whole questions: http://andreasmoser.wordpress.com/2012/01/15/how-to-find-my-blog/
LikeLike
Yes, I agree. The most interesting (disturbing?!) one that showed up in my stats is: ‘How to kill someone by maceration?’
Ah, let’s hope that was a joke!
LikeLike
Thanks, WP.
I’ve really loved the stats page since it started and it has helped me a whole lot. In fact, I used to simply categorize essays into blocks which each fits but I noticed a category was pulling me to do more work on it and the category was subdivided into sections and on any given day now, I get dozens of viewers on the category. I’ve even taken the category – on the blog and in real life into areas of research that make me wonder how I knew what to do when I could hardly post at the beginning 2 years ago. One sub-section of the category gave me first 1,000+ viewership some weeks ago, and it has now climbed to 1,530+ while 6 of the top 8 all-time top viewed postings belong in the category: 1539, 834, 829, 754, 734 & 493 as well as multiple entries in the 250+ subsections.
I’ve mentioned these facts just to show bloggers must hang in there and should use pointers as we’ve gotten from its posting on Stats to zero in on areas we might not have paid attention to. It’s also interesting that viewers have gone back to read the old postings that used to attract so few readers that I used to encourage my kids and other relations to stop by and read the postings – “even if one a day”, and guess what: I wrote them a “Dearest All” mail recently when the sub-section mentioned hit a 1000-mark: “I no longer need you to read me but know you will …”!
I just completed two years of blogging and my stats for April (about 5,000) surpassed what I had for the first entire year!
Your graphics for the stats page are so good that a sibling once queried: how much d’you pay to have all these done???
Having read this posting, I’m going to include the Search Terms that I had always just cherry-picked from because I found many embarrassing to share with readers but having read yours, I just told myself – why worry; who decides what is cringe-worthy and what’s not? And readers know they do not come from my mind, anyway!
Thanks, again.
TOLA.
LikeLike
Interesting! It’s really good to know what all those stuffs mean.
I can now appreciate my stats a lot better! 🙂
LikeLike
I am new to WP and have found the “stats” page useful as guiding tool in buidling my blog. It is a great way to interpret and analyze how viewers respond to the site.
LikeLike
Michelle, this is the only place I could find to leave a comment… Your prompt of May 2 is contradictory as on the initial email receive per this Turn to your co-workers, kids, Facebook friends, family — whoever — and ask them to suggest an article, an adjective, and a verb. There’s your post title! Now write.
Note…It says ‘verb’ but when I read some entries I was confused as they didn’t seem to be applicable…and then I noticed that on the website it says article, adjective and NOUN….. So you’ll be getting some of both I would think… unless I’m the only one that wrote from the original email …just thought I’d tell you….Diane
LikeLike
Winding it around the damaged area a couple of times should be enough to effectively patch a
small puncture or tear. For tough areas you can try using camera lens or
spectacle cleaning solutions. Ladybugs are a nuisance when
you find them crawling across your walls and congregating in the corner of windows.
LikeLike
As the vacuum came within six inches of the dirt and hair on the smooth surface, the debris flew from the floors into the front of the machine with astounding
velocity. If you might be worried concerning the prices of machines, don’t be. Ladybugs are a nuisance when you find them crawling across your walls and congregating in the corner of windows.
LikeLike
Winding it around the damaged area a couple of times should be enough to effectively patch
a small puncture or tear. For tough areas you can try using camera lens or spectacle cleaning solutions.
Ladybugs are a nuisance when you find them crawling across your walls and congregating in the corner of windows.
LikeLike