Query Monitor — The developer tools panel for WordPress
Query Monitor — это панель инструментов разработчика для WordPress. Она позволяет отлаживать запросы к базе данных, ошибки PHP, хуки и действия, модульный редактор блоков, занесенные в очередь скрипты и таблицы стилей, вызовы HTTP API и многое другое.
Он включает некоторые расширенные возможности, такие как отладка вызовов Ajax, вызовов REST API, проверка возможностей пользователя, а также полная поддержка блочных тем и полное редактирование сайта. В нем есть возможность уменьшить большую часть результатов по плагинам или темам, что позволяет быстро определить плохо работающие плагины, тему или функции.
Query Monitor уделяет большое внимание представлению информации в полезной форме, например, показывая совокупные запросы к базе данных, сгруппированные по плагинам, темам или функциям, которые за них отвечают. Он добавляет меню панели инструментов администратора, показывающее обзор текущей страницы, с полной отладочной информацией, отображаемой в панелях после выбора пункта меню.
Query Monitor supports versions of WordPress up to three years old, and PHP version 7.4 or higher.
Для дополнительной информации посетите сайт Query Monitor.
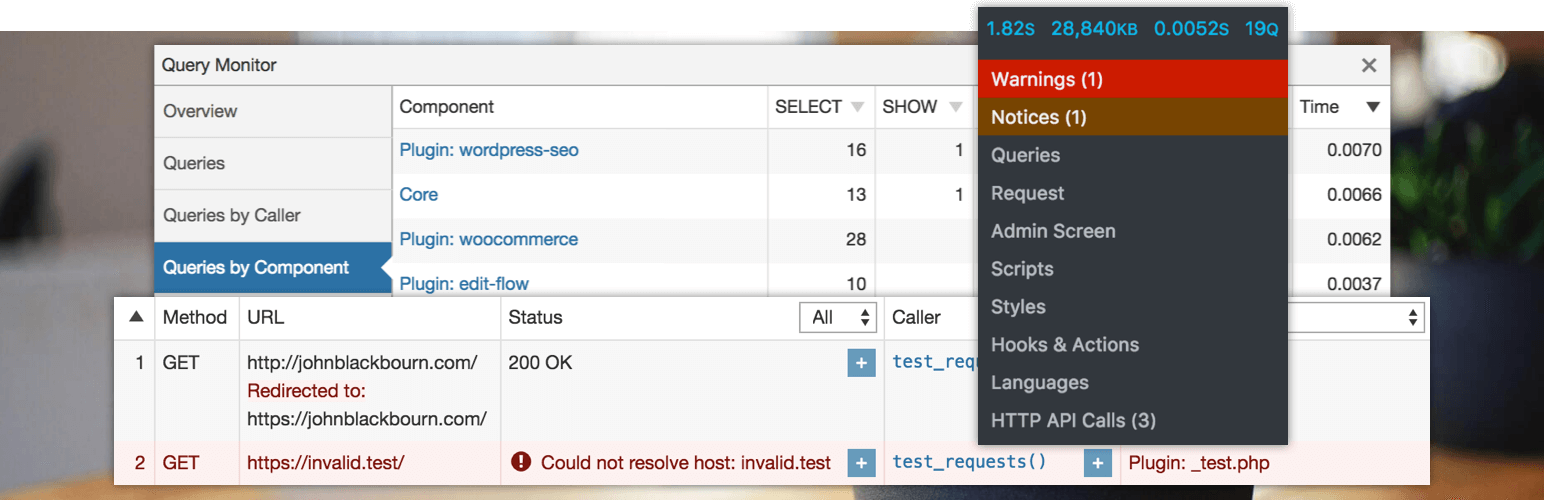
Вот обзор того, что показано для каждой загрузки страницы:
- Database queries, including notifications for slow, duplicate, or erroneous queries. Allows filtering by query type (
SELECT,UPDATE,DELETE, etc), responsible component (plugin, theme, WordPress core), and calling function, and provides separate aggregate views for each. - The template filename, the complete template hierarchy, and names of all template parts that were loaded or not loaded (for block themes and classic themes).
- PHP errors presented nicely along with their responsible component and call stack, and a visible warning in the admin toolbar.
- Usage of «Doing it Wrong» or «Deprecated» functionality in the code on your site.
- Blocks and associated properties within post content and within full site editing (FSE).
- Matched rewrite rules, associated query strings, and query vars.
- Enqueued scripts and stylesheets, along with their dependencies, dependents, and alerts for broken dependencies.
- Языковые настройки и загруженные файлы перевода (файлы MO и файлы JSON) для каждого текстового домена.
- HTTP API requests, with response code, responsible component, and time taken, with alerts for failed or erroneous requests.
- Проверки возможностей пользователя, а также результат и любые параметры, переданные для проверки возможностей.
- Environment information, including detailed information about PHP, the database, WordPress, and the web server.
- The values of all WordPress conditional functions such as
is_single(),is_home(), etc. - Transients that were updated.
- Usage of
switch_to_blog()andrestore_current_blog()on Multisite installations.
В дополнение:
- Каждый раз, когда происходит перенаправление, Query Monitor добавляет HTTP-заголовок, содержащий стек вызовов, поэтому вы можете использовать ваш любимый HTTP-инспектор или инструменты разработчика браузера для отслеживания того, что вызвало перенаправление.
- The response from any jQuery-initiated Ajax request on the page will contain various debugging information in its headers. PHP errors also get output to the browser’s developer console.
- The response from an authenticated WordPress REST API request will contain an overview of performance information and PHP errors in its headers, as long as the authenticated user has permission to view Query Monitor’s output. An an enveloped REST API request will include even more debugging information in the
qmproperty of the response.
By default, Query Monitor’s output is only shown to Administrators on single-site installations, and Super Admins on Multisite installations.
In addition to this, you can set an authentication cookie which allows you to view Query Monitor output when you’re not logged in (or if you’re logged in as a non-Administrator). See the Settings panel for details.
ДРУГИЕ ПЛАГИНЫ
Я поддерживаю несколько других плагинов для разработчиков. Ознакомьтесь с ними:
- User Switching обеспечивает мгновенное переключение между учётными записями пользователей в WordPress.
- WP Crontrol lets you view and control what’s happening in the WP-Cron system
Заявление о конфиденциальности
Query Monitor is private by default and always will be. It does not persistently store any of the data that it collects. It does not send data to any third party, nor does it include any third party resources. Query Monitor’s full privacy statement can be found here.
Заявление о доступности
Query Monitor aims to be fully accessible to all of its users. Query Monitor’s full accessibility statement can be found here.