Query Monitor – El panel de herramientas para desarrolladores de WordPress
Query Monitor is the developer tools panel for WordPress. It enables debugging of database queries, PHP errors, hooks and actions, block editor blocks, enqueued scripts and stylesheets, HTTP API calls, and more.
It includes some advanced features such as debugging of Ajax calls, REST API calls, user capability checks, and full support for block themes and full site editing. It includes the ability to narrow down much of its output by plugin or theme, allowing you to quickly determine poorly performing plugins, themes, or functions.
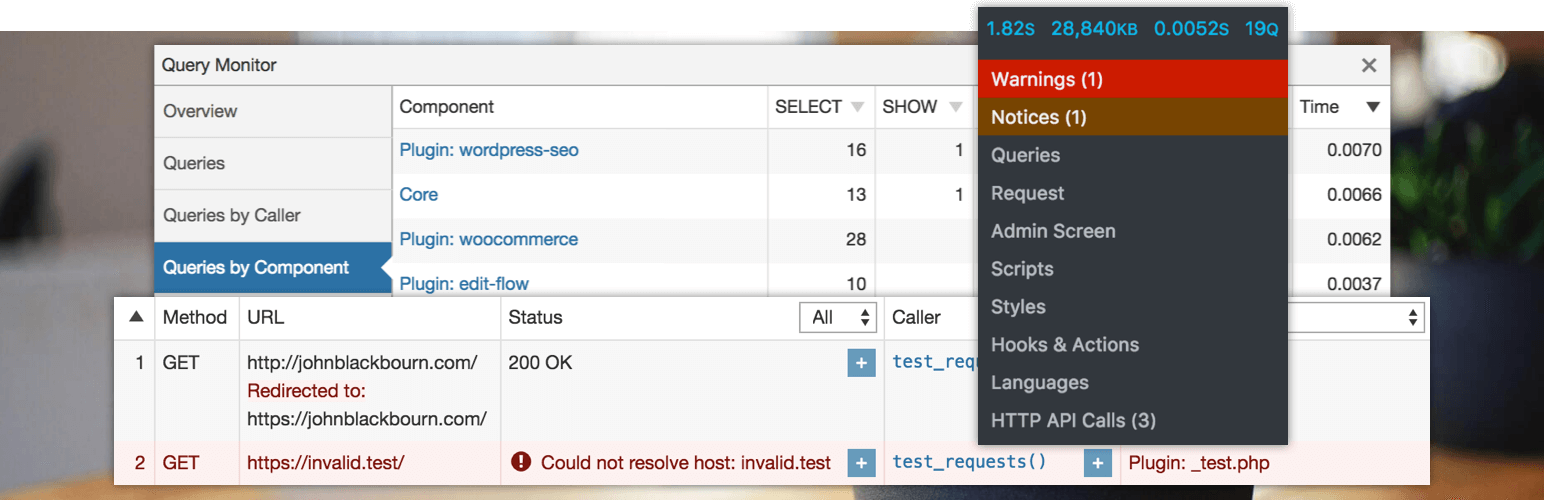
Query Monitor focuses heavily on presenting its information in a useful manner, for example by showing aggregate database queries grouped by the plugins, themes, or functions that are responsible for them. It adds an admin toolbar menu showing an overview of the current page, with complete debugging information shown in panels once you select a menu item.
Query Monitor es compatible con versiones de WordPress de hasta tres años de antigüedad, y con la versión 7.4 o superior de PHP.
For complete information, please see the Query Monitor website.
Here’s an overview of what’s shown for each page load:
- Database queries, including notifications for slow, duplicate, or erroneous queries. Allows filtering by query type (
SELECT,UPDATE,DELETE, etc), responsible component (plugin, theme, WordPress core), and calling function, and provides separate aggregate views for each. - The template filename, the complete template hierarchy, and names of all template parts that were loaded or not loaded (for block themes and classic themes).
- PHP errors presented nicely along with their responsible component and call stack, and a visible warning in the admin toolbar.
- Usage of «Doing it Wrong» or «Deprecated» functionality in the code on your site.
- Blocks and associated properties within post content and within full site editing (FSE).
- Matched rewrite rules, associated query strings, and query vars.
- Enqueued scripts and stylesheets, along with their dependencies, dependents, and alerts for broken dependencies.
- Language settings and loaded translation files (MO files and JSON files) for each text domain.
- HTTP API requests, with response code, responsible component, and time taken, with alerts for failed or erroneous requests.
- User capability checks, along with the result and any parameters passed to the capability check.
- Environment information, including detailed information about PHP, the database, WordPress, and the web server.
- The values of all WordPress conditional functions such as
is_single(),is_home(), etc. - Transients that were updated.
- Usage of
switch_to_blog()andrestore_current_blog()on Multisite installations.
In addition:
- Whenever a redirect occurs, Query Monitor adds an HTTP header containing the call stack, so you can use your favourite HTTP inspector or browser developer tools to trace what triggered the redirect.
- The response from any jQuery-initiated Ajax request on the page will contain various debugging information in its headers. PHP errors also get output to the browser’s developer console.
- The response from an authenticated WordPress REST API request will contain an overview of performance information and PHP errors in its headers, as long as the authenticated user has permission to view Query Monitor’s output. An an enveloped REST API request will include even more debugging information in the
qmproperty of the response.
By default, Query Monitor’s output is only shown to Administrators on single-site installations, and Super Admins on Multisite installations.
In addition to this, you can set an authentication cookie which allows you to view Query Monitor output when you’re not logged in (or if you’re logged in as a non-Administrator). See the Settings panel for details.
Otros plugins
Mantengo varios otros plugins para desarrolladores. Échales un vistazo:
- User Switching ofrece cambio instantáneo entre cuentas de usuario en WordPress.
- WP Crontrol te permite ver y controlar lo que sucede en el sistema WP-Cron
Privacy Statement
Query Monitor es privado por defecto y siempre lo será. No almacena de forma persistente ninguno de los datos que recoge. No envía datos a terceros, ni incluye recursos de terceros. Aquí se puede encontrar la declaración de privacidad completa de Query Monitor.
Accessibility Statement
Query Monitor pretende ser totalmente accesible para todos sus usuarios. Aquí se puede encontrar la declaración de accesibilidad completa de Query Monitor.