Or more than just an excuse to down a pint of Ben and Jerry’s and vow to give up blogging forever, as the case may be.
Most of us look at our stats more than we probably should; it’s natural to want to see whether anyone’s paying attention, and undeniably gratifying to watch the graphs go up, up, and away. But if you’re trying to build a readership and are not using the world of data lurking in your stats to inform your blog and boost your traffic, you’re missing out. Your stats page is way more than a bunch of charts with the power to boost or kill your confidence — it’s a bunch of charts that give you the ability to see into the minds of your readers and shape your blog accordingly.
Before we go any further, a caveat. This post is simply intended to help you pull information from your stats that might help you boost traffic and engage readers, but we know that for some of you, that’s not the point of blogging. There are plenty of people who use their sites as personal spaces to muse, vent, play with words, make one-on-one connections, or do a thousand other things that aren’t about building traffic. If that describes you, then keep on keeping on and ignore this post! If you’re looking to build more of an audience for your site, read on.
There’s a huge quantity of data captured on your stats page. For today, we’re going to focus on overall views and visitors, top posts and pages, and tags, and search engine terms.
Views and Visitors
This is the big ol’ graph with the light and dark blue bars right at the top of the page. Here’s ours:
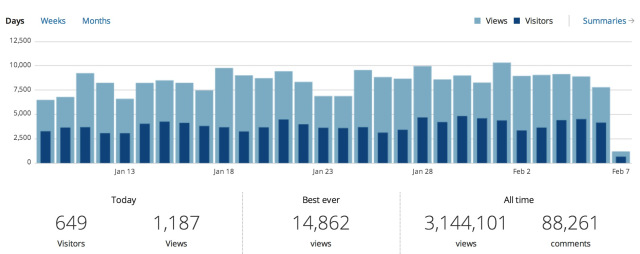
This chart tracks both views and unique visitors; the light blue bars represent views, and the darker blue represents unique visitors. A view is counted every time anyone loads a page on your blog (for example, your “About” page or an individual post’s page), while a unique visitor is counted whenever a user visits your blog for the first time that day, week, or month. If your mom visited your blog twice today and clicked on three pages, she’d show up as three views and one unique visitor for the day.
At the top of the chart, you can choose what time period it covers — days, weeks, or months. Day view is great for seeing the impact of specific posts, but week and month view give you the data that helps you grow.
Looking at your stats in week or month view, you can see what happened when you started posting more frequently, introduced that new feature, or changed your theme. You can see whether there are times of the month or year that are bigger for you; maybe you write a food blog and see holiday season spikes as the internet descends on your killer cranberry sauce recipe, or your pop culture blog gets a boost from tired workers killing the last few hours of a Friday afternoon.
Use this information to inform (or create) your posting schedule. You can either map out a calendar in advance (“I’ll prep eight Passover recipe posts and roll them out as the holiday approaches.”) or just time your posts to coincide with your visitors — there’s no need to rush to hit publish on a post you wrote on Saturday if your traffic spikes on Tuesdays. These stats might also give you insights into your content, especially if you write about multiple topics. Perhaps there’s one topic that resonates with more people, or different topics are more popular at different times. Which brings us to…
Top Posts, Pages, and Tags
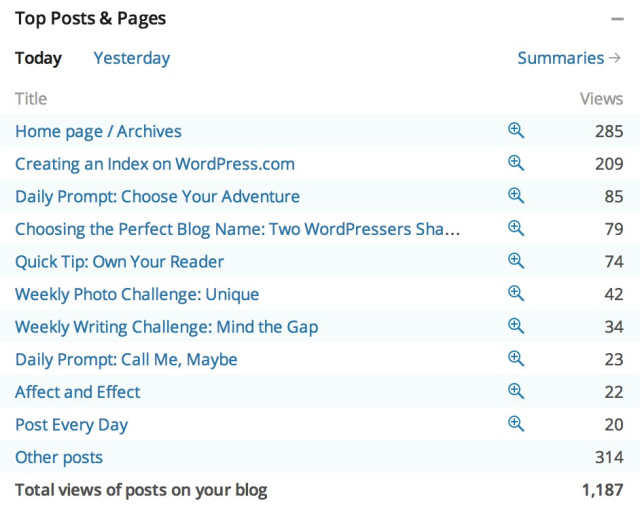
“Top Posts & Pages” collects data on, um, your top posts and pages:
While “Top Tags” does the same for — you guessed it — tags:
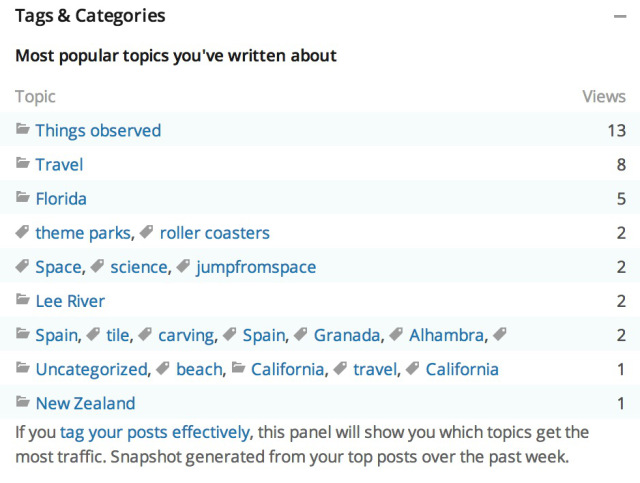
You can quickly see what readers were most drawn to yesterday and today, and click on “Summaries” to access historical data and see what’s been popular in the past week, past month, or over the lifetime of your blog. Make sure you’re tagging your posts effectively to get the most out of these stats.
See if there are particular topics where your blog shines, or if you can spot trends among popular posts. Then, you can give you readers more of what they enjoy: try a follow-up to your most popular post, or introduce a new series based on reader interest. If a series or topic is falling flat, you can consider retiring it and experimenting with something new based on what people are responding to.
You might also use menus and widgets to direct people to your best stuff. Link to your greatest hits right from your “About” page, or add a widget listing your most popular posts — drive new visitors to posts that will suck them in, and they’ll be more likely to stick around.
It’s also smart to see what pages are racking up the views so you can keep them up-to-date. Since pages are static, we can easily forget about them and let their content grow stale. Your “About” page is a prime candidate — when was the last time you looked at that thing? (If yours hasn’t been refreshed since you started your blog, check out About 101 and 201 for help breathing in some new life.)
Search Engine Terms
The search terms data is the piece of your stats page most likely to make you snort ginger ale out your nose in laughter, horror, or both. These are the terms people Googled (or Yahoo-ed, or Bing-ed, or whatever-ed) to find your site. Here’s a sample of ours:
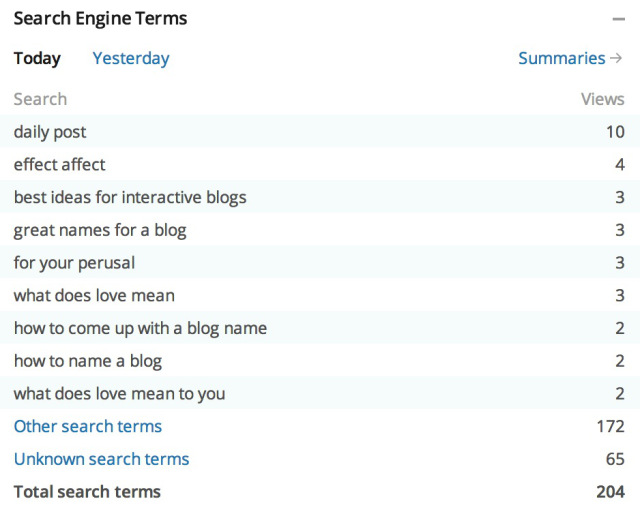
As you can see, we’re popular with both bloggers and hopeless romantics.
Thanks to the wonders of search algorithms, these stats will be full of hilarious, confusing, and infuriating terms that you’ve probably never written about, ever. At the very least, you’ll get fodder for the ever-popular “Look at these ridiculous search terms!” post; at best, you’ll find more useful data on what subjects people are interested in and what kinds of key words and phrases will make your posts and titles sing.
There’s lots of other helpful information on your stats pages, like readers’ countries and sites that refer readers to you; we’ll touch on that in a future post.
Have you used your statistics to inform your blog, or are they just a fun distraction? We’d love to hear from those of you who have used your stat data to engage and grow your readership!
Currently blogless? You’re a click away from sharing your story.
Create your blog at WordPress.com


Thisvacuumisalsoequippedwithareversiblewandthatcanreachhighoutofthewayplaces.
You’ll use the brush in conjunction with the vacuum and cloth (see the next two items). What happens is when the vacuum cleaner bags get full the motor of the cleaner start to loose their efficiency and cleaning process fails.
LikeLike
Clogged hoses and brushes prevent suction from grabbing hold of dust and debris.
You don’t need to guess if your vacuum cleaner’s filter is clog or not.
To make sure that the vacuum is working at its best, make sure that the dust bag is not kept full and overflowing.
LikeLike
Such useful information. People have said it all above, so all I can say is thank you!
LikeLike
Reblogged this on My rambling thoughts.
LikeLike
This is quite helpful. I just noticed–this is stats related but only the kind of stats I personally monitor myself–that when I post between 11am and 2pm Central Time (most of my posts are tagged with “Poetry”), I get multiple hits and Likes within minutes of the post. So I would suppose a lot of poetry fans check their readers at those hours. Since I am a stream-of-consciousness kind of poet, I still prefer to post right after writing, regardless if the time of the day does not coincide with those “peak” reader hours. But when I can help it, I try to post on those hours. ^_^ Thanks for this post!
LikeLike
I’m a grown ass woman dominated by two colored bars than didn’t even go to the effort of being different colors, just shades of one another. Wow, is this what my teachers and parents meant as “success”?
http://nicholiovich.wordpress.com/ is where you can find me.
LikeLike
What I would find really handy would be to be able to tell what time (in my own countries time zone) that the “likes” on my posts happened, is there any way of telling that I can then work out when best to schedule my posts to go live.
LikeLike
Great post and fully agreed on the snort milk through your nose section [although mine would be more like ‘raise eyebrows with slight trepidation and fear’ – my nickname is ‘Fish’ and i have written some blogs on helping people who are struggling with pornography/masturbation and almost every day i have people arriving at my blog who have googled “masturbation with fish” – as i suggested this is a little more disturbing than funny and i imagine there are a lot of disappointed people who arrive at my blog as that is not a topic i have covered to the extent that someone googling it might be appreciative of…
LikeLike
Thanks for the post and loved all the comments. Very informative for a 2-month old weekly blogger (it’s a sewing blog, ya’ll).
Yes, I do hit the stats link more frequently than I was advised by other bloggers (probably the ones who “blog for themselves”). I have discovered that after announcing a new post on Twitter (my handle is @seweverything), and IF it gets re-tweeted by someone with a high follower count, my stats spike considerably. I also update my Facebook page and it does a little good but not much. Maybe I should get active and friend more people. But at this time the retweet is king :).
LikeLike
Reblogged this on Marc Climaco.
LikeLike
Thank you for the very informative post. It answers questions I’ve had about how the “view” stats are counted.
LikeLike
I enjoy looking into my stats 🙂
LikeLike
I’ve been watching my site stats since I started blogging, and the tags really help, me to decide where to tag my posts again. Also, it seems that I get a lot of referral from by theme (that I used to designed the website) I didn’t know that wordpress, showed my blog as an example for people wanting to use my theme, so alot of folks have been finding my blog that way, as well as clicking on my gravatar icon.
LikeLike
This has been extremely helpfu! Going to reblog this in The Art of Musical Poetry!
LikeLike
Reblogged this on The art of musical poetry.
LikeLike