
Chances are, you started your website with certain goals in mind. There was something you wanted to achieve with it, a vision or dream in your mind that you were trying to make a reality. However, how do you know if you are getting closer to that dream? The answer: by tracking website performance metrics.
Choosing the right site statistics and setting up the processes to follow up on them is key to making sure your efforts are going in the desired direction. Without reliable data, you are basically flying blind and might do things that are counterproductive to your website’s success. In order to avoid that scenario, today we want to talk about how to correctly set website goals and pick the right metrics to pursue them.

In the following, you will learn why it’s important to choose objectives for your site and also how to select the right ones for you. After that, we give you a step-by-step breakdown of the most important website metrics to keep track of and also tools that allow you to do so. In the end, you will know exactly which stats are relevant to you and how you can stay on top of them.
Why Should You Establish Objectives for Your Website?
Let’s first start with the big question.
Why should you set goals for your website and track them?
For especially creative people, getting down to hard numbers can feel a bit constraining and “unromantic”. Who wants to break down their passion project into a bunch of statistics?
However, as mentioned in the beginning, you probably had certain aspirations for starting your website:
- Build an online business
- Attract clients for your freelance services
- Spread ideas you care about via your blog
- Establish yourself as a voice in your industry
- Run an online shop
Whatever your personal reason, ask yourself, what does all this mean in concrete terms? How would you know that you have achieved what you set out to do? What does success look like?
Performance Metrics Make Website Goals Graspable
Chances are you have a least a murky idea of what success could look like, even if you haven’t formulated it numerically yet. Maybe success for you is to have 1,000 visitors per month, maybe it’s a certain amount of revenue (like enough to live off of), or maybe you want to bring in X amount of leads to your business.

Creating one main goal like this gives you something specific you can work towards and can be a powerful motivator. It also eliminates indecision and aimlessness and provides you with a focus for your efforts.
Does that mean that’s the only statistic you should track?
No. Following up on your website metrics in general has other benefits. It allows you to understand your site, audience, and business better. The numbers can show what content resonates most with your readers or whether your marketing strategy is working. They also show if your site is bringing in sales or what part of your offer visitors are most or least interested in.
In short, tracking website statistics allows you to understand both how well your site is performing and how its performance is impacting your business.
How Should You Set Goals for Your Website?
Of course, the question from here is how you can set up goals for your own site. Obviously, different types of websites need different types of objectives. Therefore, you need to answer this question individually.
We have already talked about the kinds of websites you might be trying to build and the goals that can spring from that. Here are some more ideas:
- Convert X percent of visitors to paying customers
- Bring in a certain number of newsletter signups or followers
- Send X number of visitors to your “we’re hiring” page
- Get X people to buy your online course
- Move X many visitors to sign your online petition
You can also have more than one goal, e.g., attracting a specified number of visitors to your blog and then turning a defined percentage of them into newsletter subscribers or paying customers. However, you will usually have one main metric that means you are achieving your website’s target or not. Be crystal clear about what that is because it determines a lot of the actions you will take to get there.
Are you not yet sure what metrics are most relevant to your site? No worries, we will discuss the most important ones now together with how to track them.
Website Metrics You Can Track in Jetpack
When your website is running on WordPress, one free tracking tool that’s at your disposal is Jetpack. It comes pre-installed on any WordPress.com website, and you can also use it for self-hosted WordPress sites. On plugin-enabled plans, you get access to more Jetpack features like backups and one-click restores, however, website statistics are included with all plans.
You can find the Jetpack Stats menu under Stats in WP Admin, and Jetpack offers a number of metrics you can track.

Views
Views describe the number of pages that visitors on your site look at. Whenever someone enters your website, clicks on another page, or even just reloads the same page, that is a view.
For that reason, they are usually higher than the pure number of visitors because, ideally, your audience members look at more than one page. If not, that also tells you something, for example, that you might have to do a better job of interlinking your pages and articles.
In Jetpack stats, you find views both as a number at the top and statistics over time in the graph below. It is also the value used to rank your most important posts and pages, referrers, visitor countries, authors, and more.

When you click on individual posts and pages, you can also see their views broken down by months, years, daily average, and recent weeks.

Finally, in the Insights tab, you find additional information such as all-time views, most popular view times, and views per month.

Visitors
As mentioned above, this website metric strongly correlates with views. However, counting visitors also makes sense on its own, especially to understand performance metrics like your conversion rate (more on that soon).
Like views, in Jetpack you find the visitor number on the Stats main page both in number and graph form.

In fact, when you look back at the Views graph, you see that it is by default underlaid with the number of visitors so that you automatically get a good grasp at how many pages each visitor checks out.

Insights also lets you check out how many visitors you attracted overall.
Likes
Likes is purely a WordPress.com metric. While you are probably familiar with liking things on social media, in this case, it’s a built-in feature. Anyone who is logged into WordPress.com can click the Like button on your content pages to show their approval.

When they do, you can see the total number of likes in the Jetpack stats screen both in numeric form and as a graph.

They also appear in the yearly overview of the Insights section and in the breakdown for single posts and pages.
Comments
Comments are an important metric to gauge engagement on your website. If readers regularly leave comments below your posts and there is a healthy discussion going on, that’s a great sign that you are building a community.
Because they are such an important sign for your site, tracking them is built into Jetpack as well. You can see the number of comments on the main page in the usual forms.

Jetpack will also tell you about the number of comments per year and their overall number under Insights. If you have comments on your site enabled, that number will also be higher than zero.
Top Posts and Pages
We have referred to it before a few times, so you are probably already aware that Jetpack shows you a list of your best-performing posts and pages as part of its stats.

Click View all at the bottom to see the full list including the ability to look at different timelines.
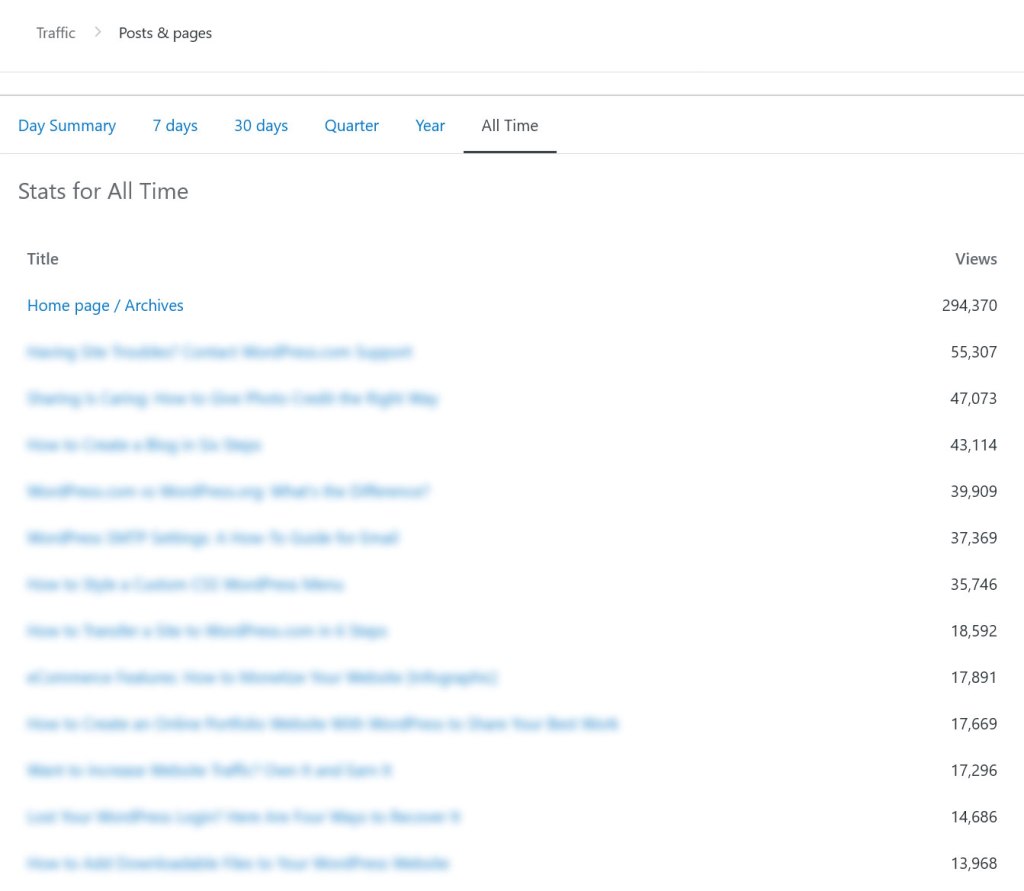
What’s more, as mentioned above, it’s possible to click on each of these to see a detailed breakdown of their statistics.
Referrers
Ideally, you will get referral traffic from several different sources, which you can find in the Referrers section.

A click on View all gives you more details as well as different time frames to look at.
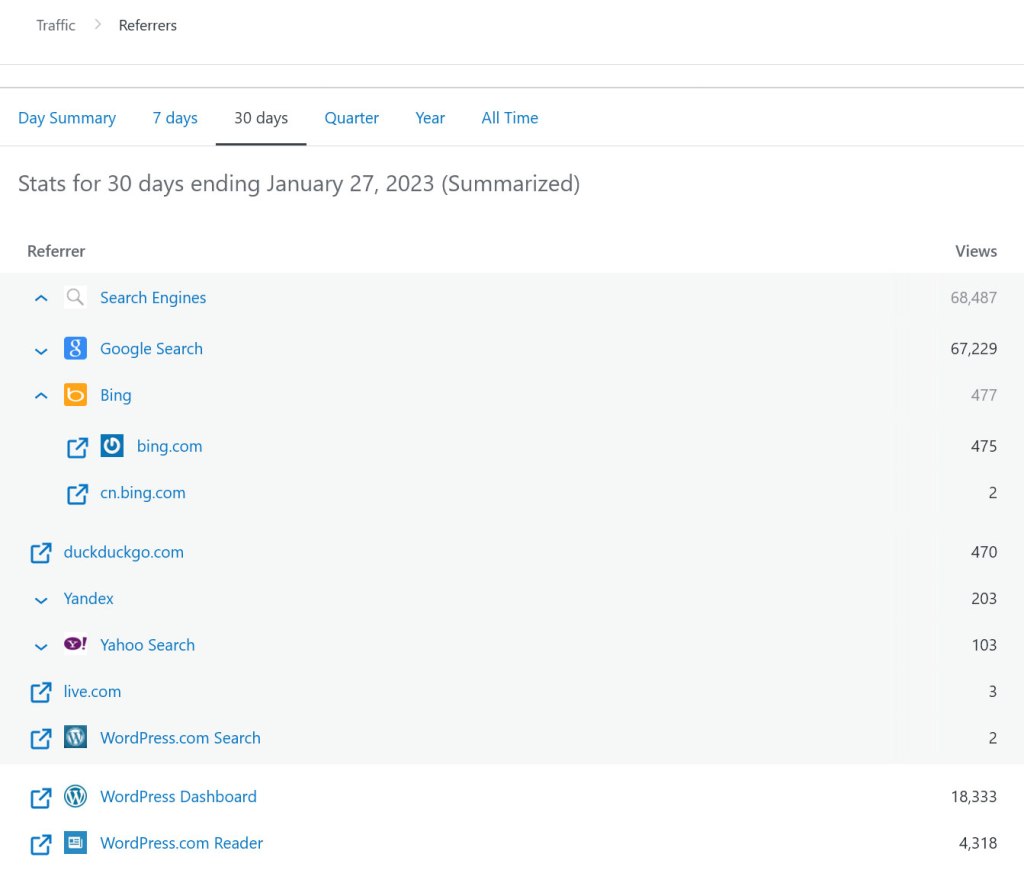
A click on any of the referrers takes you to the site in question so you can understand better who sends you traffic (e.g. to propose a closer collaboration). At the bottom, you also have the possibility to download this data in CSV form and use it elsewhere.
Search Terms
The final website metric that we want to talk about that you can find in Jetpack are search terms. Towards the bottom of the page, the plugin will record what terms have led visitors to discover your pages.

This is a great way to discover keywords that you are already ranking for so you can further optimize your content for them. A click on View details gets you to a similar menu as for referrers and top content where you can change the time frame and export your data if needed.

Further Metrics to Track to Achieve Your Website Goals
Jetpack is a great tool to gain an overview and understand the general direction your site is going. However, if you really want to dive into the nitty gritty of your site’s performance and understand your traffic and audience on a deeper level, going for a web analytics suite like Google Analytics is a better idea.

For that reason, WordPress.com has a built-in integration that easily allows you to connect your site with Google Analytics. When you do, it gives you access to the following website metrics that help you work towards your goals.
Note that we are strictly talking about Google Analytics 4 (GA4) below, which is the latest version of the analytics suite. While its predecessor Universal Analytics currently still exists, Google is sunsetting it by July 2023, so we didn’t think it necessary to include it here anymore.
Pageviews
Views, sometimes also referred to as pageviews, is a metric that means the same in Google Analytics as in Jetpack. In Google Analytics, you find it under Engagement > Events.

Click on the event name at the bottom to see this website metric on its own.

Average Time on Page
The amount of time visitors spend on your pages can tell you a lot about the quality of your content and how well it addresses their needs. If the average time is high, it means that the content is interesting and motivates most people to read a lot of it. If it’s low, it’s the opposite.
However, this is not a cut-and-dry rule. When looking at time on page, you also have to take into account the amount of content on the page. Naturally, a shorter page will have people leave earlier. It’s also possible that visitors come to a certain page with a particular question in mind that the page immediately answers, so there is no reason to stick around any longer. Just keep that in mind.
If you want to learn how long your visitors stay on your pages, Google Analytics 4 calls this metric Average engagement time and displays it on the starting page and under Engagement > Engagement overview.

Entrances and Exits
These metrics describe which pages visitors use to first enter and leave your website. For example, an entrance can be an article they find in search results or a link they click on another site. An exit, of course, is the last page they look at before ending their stay.
Tracking these allows you to understand which pages are the biggest audience magnets and also where you lose visitors. The latter is especially important when considering pages that are supposed to be used in sequence, like a sales funnel or checkout process.
Entrances and exits are not a standard report in Google Analytics 4. However, you can set them up under Explore in the left menu.

Here you can set up custom reports for different metrics. Create a blank report and give it a name. Under Dimensions, choose Page title and screen and then pick Entrances and Exits as Metrics. After that, choose Page title and screen under Rows and pick Entrances and Exits for Values in order to create the report (it gets saved automatically).

Bounce Rate
The bounce rate is the share of users who leave your website after looking at just one page. A high bounce rate is often an indicator that you could do a better job at funneling people to other parts of your website or that the quality of your content is lacking.
This website metric does not appear in Google Analytics 4 by default either. However, you can easily add it in the Pages and screens report that you can find under Engagement. Here, the first step is to click on Customize report (the pencil icon in the upper right corner).
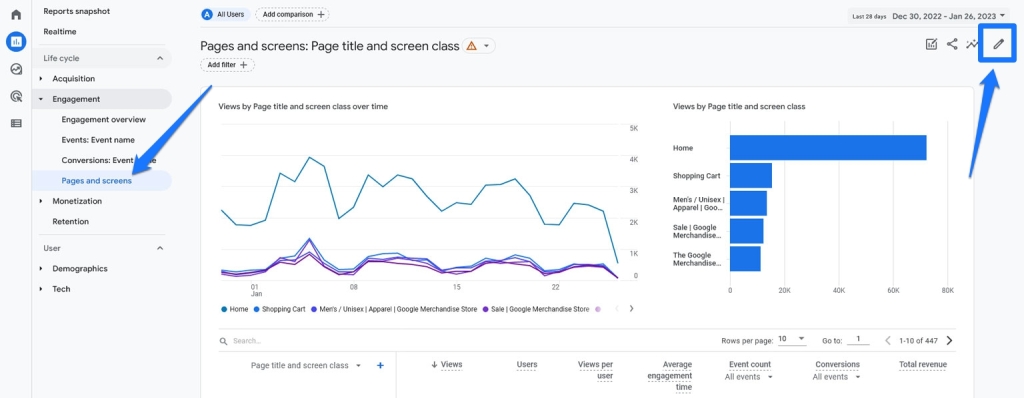
After that, in the Report data section, click on Metrics.

In the next screen, use the drop-down menu to add a metric and pick Bounce rate.

Drag it where you want it to appear, then apply the changes, and save the report.

After that, bounce rate will be visible as part of your website performance metrics.
New Users
This metric describes users who came to your site for the first time during your tracking interval. If their share is very high, it can mean that you need to invest in fostering loyalty and giving people reasons to come back to your site.
You find the metric of new users on the Reports snapshot at the beginning of Google Analytics.

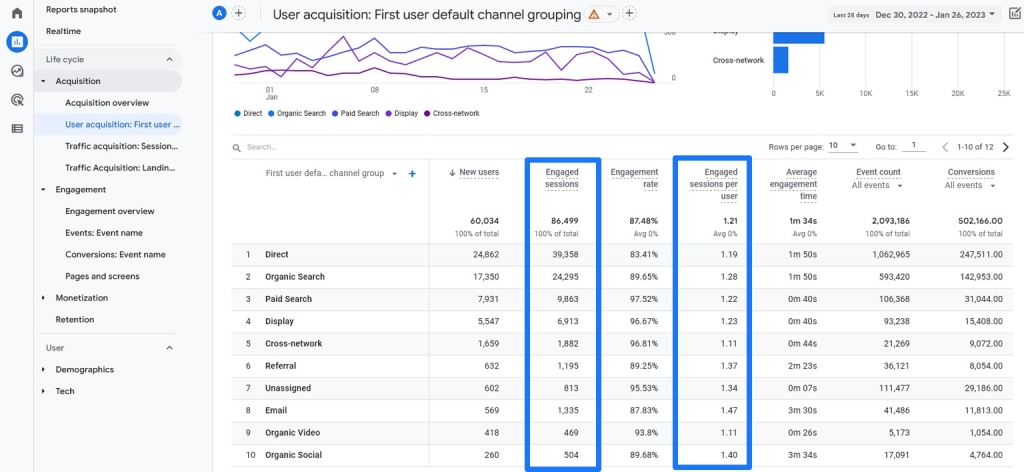
You can also see where they come from in Acquisition > User acquisition.

Returning Users
As you can probably deduce, returning users are the opposite of new visitors. They have been to your website before and are coming back for more.
Seeing a good chunk of returning visitors is usually a good thing. It means that they liked what they found the first time around and are coming back either to re-read something, check out your other content, or see if you posted something new. It can also simply be that you showed up for one of their other search inquiries, and they clicked on your link because of their previous positive experience.
In Google Analytics 4, the Retention section contains all the information about returning users.

It shows you their number, how well you are doing at attracting new users to come back to your site, and how engaged they are when they return.
Sessions
A session happens whenever a user comes to your site and stays active on it. When they leave or after 30 minutes of inactivity, Google Analytics ends the session. It’s basically a metric that spans their entire visit. During that time, they can add several views, conversions, and other entries to your analytics.
Google Analytics offers a number of website metrics on this topic that you can add to the User acquisition report, as shown earlier. Besides Sessions, that includes Sessions per user and Average session duration (more on that below). Google Analytics also has default metrics on this topic, like Engaged sessions and Engaged sessions per user.
Pages Per Session
This is the number of pages that users look at during their visit. It’s another way to learn about their engagement level. More pages mean more engagement and vice versa.
This was a standard value in the old version of Google Analytics but is not a default in the new version. However, just like many of the other metrics, you can set it up yourself. Yet, the process is a bit more lengthy than we have space for here, so we would ask you to refer to the official documentation.
Average Session Duration
We have already mentioned how to make this show up in User acquisition above.
Why should you make this part of the website metrics that you track?
Because, again, it’s something that allows you to gauge the level of audience engagement. Like time on page, it lets you know how well you manage to address their needs, however, this time, not on a per-page basis but for their overall visit.
Traffic Channels
This is also relatively easy to deduce from the name. It simply describes where you acquire your visitors from. That can be search engines, direct traffic, traffic from social media, through a website link, paid, or else.
Why is it important to know this?
Your traffic channels can tell you a lot about whether your marketing approach and traffic acquisition plan is working. This data also allows you to double down on traffic channels that are going well but maybe weren’t part of your initial approach. In addition, it tells you if it’s time to diversify because you might be too dependent on one type of traffic source.
You find this information under the User acquisition section.

If you want it broken down on a user and session level, be sure to also visit User acquisition and Traffic acquisition. Most importantly, be aware that you can use the drop-down menus to see your data broken down in different ways, such as the exact websites sending you traffic and not just whether it’s organic, direct, or else.

Device Sources
Under Tech, Google Analytics allows you to learn more about the devices that visitors use to come to your website. That includes whether it’s desktop or mobile devices, their browsers, operating systems, and screen resolutions.

Under Tech details, you can further drill down into this data (again, remember the drop-down menus to change what data you view).
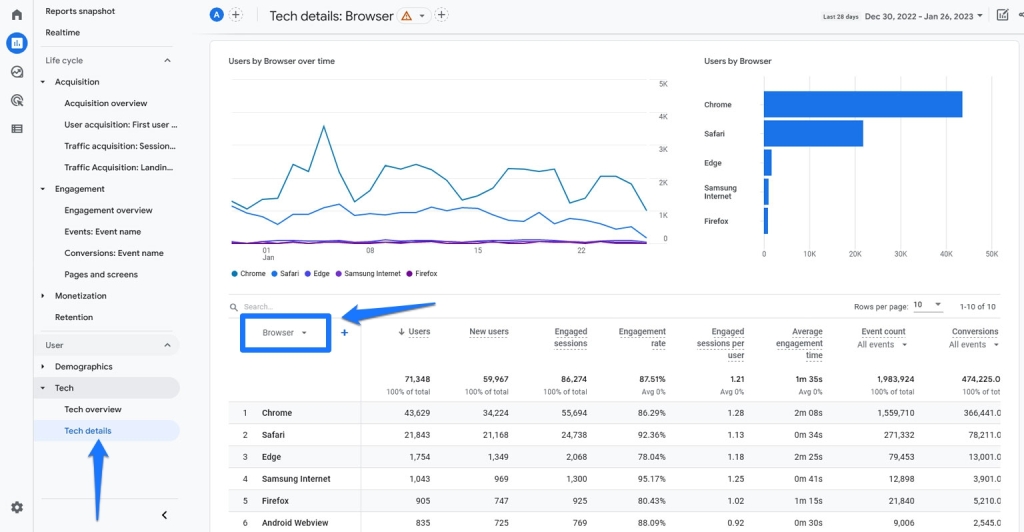
How is this of significance?
This information about your audience enables you to make sure that your website works well on a technical level for the majority of your users, such as checking your site in their favorite browser and the most common screen resolutions.
Conversion Rate
A conversion can be a lot of different things. It depends on what the goal of your site and pages is. In general, the conversion rate simply means the percentage of total visitors who have taken the action that you want them to perform. What exactly that action is, such as making a purchase, signing up for a newsletter, or clicking on an affiliate link, is up to you.
If you want to measure your conversion rate in Google Analytics, you find it both in User and Traffic acquisition.

However, in order for it to make sense, you also need to set up events that it should use to track conversions. By default, it only has purchase as an event and you need to set that one up first as well. If you want to use something like lead generation or similar, that first needs to exist as an event before you can track it in conversions.
Revenue and Monetization
If you are running an online shop, Google Analytics can also track transactions, revenue, and other business data for you. You find all of it under Monetization.

Metrics include such things as the number of purchases and overall revenue, first-time purchasers, and average revenue per user. You can also see it broken down by revenue per product ID or order coupon. Under Ecommerce purchases you find further information about what items visitors view, add to their cart, and end up purchasing.

However, in order to have access to any of this, you first have to set up ecommerce events.
Other Site Statistics to Monitor
Besides the above, there are two more website performance metrics that you should keep an eye on.
Site Speed
The page loading speed of your website is a very important indicator of user experience. Website visitors don’t like waiting, so if your pages don’t show up within a few seconds, they are likely to leave.

Because they want to give their users the best possible experience, search engines also punish slow-loading websites, therefore, this is an SEO issue as well.
So, how can you make sure that your site loads fast enough?
The first step to that is to test your website speed. For that, enter your URL into PageSpeed Insights, Pingdom, or GTmetrix. These tools will give you a rundown of how well your site is performing and also give you actionable tips on how to improve website performance.

By the way, if you are a WordPress.com customer, you have already made good strides towards a fast-loading website. We offer multiple caching layers, a built-in content delivery network, and, for plugin-enabled plans, speed optimization plugins like Page Optimize. In addition, all available themes on WordPress.com are speed optimized.
As a consequence, a site hosted with us is already set up for blazingly fast loading speeds. If you want to know how you can further contribute to making your site faster, you can start here.
Mobile-Friendliness
The final website metric that you should track is mobile friendliness. These days, the majority of web surfing is done with mobile devices.

In addition, Google has switched to mobile-first indexing. That means they use the mobile version of your site as the basis to decide your ranking. As a consequence, you absolutely have to make sure that your website is usable for visitors on mobile devices.
There are tools out there that can help you do so, most prominently the mobile friendliness test by Google.

It works just like the speed tests. Enter your URL, wait for the results, and receive concrete tips on how you can make your site more mobile-friendly.
Here, too, as a WordPress.com customer, you are automatically ahead of the curve. All the themes in our theme directory are mobile-optimized out of the box. So, if you use one, your site will adjust to any screen size without any action needed on your end.
Speed optimization is another big factor for mobile users (due to slower Internet connections), but we already covered that.
Website Goals and Performance Metrics in a Nutshell
Setting goals for your website and following the right metrics to achieve them is essential for your site’s success. Without a reliable way of keeping track of the direction you are going, it’s much harder to end up where you would like to. It’s like trying to navigate without a map or compass.
What goals apply to your website depends on its nature. Whether you are trying to build an audience, sell products, or else, make sure that you are clear about it beforehand. Then, with your goals in mind, you can take advantage of tools like Jetpack and Google Analytics to track your path. Doing so allows you to make informed decisions about your website instead of groping around in the dark.
Hopefully, you now feel more confident about both setting goals for your website and working with the right metrics to achieve them.
Want more tips? Get new post notifications emailed to you.

